


State of India's Wealth Opportunity. Is this The Money Revolution?
Is the New Era of Participation Over-Hyped?
Post COVID, we’ve been bombarded with stories about India’s transformation—how consumption patterns are shifting (like the push toward premiumisation), and how our saving and investing habits are evolving. The narrative around Financials, pushes this idea of a new, bold Indian investor, diving into stocks, mutual funds, or even crypto, and hence shying away from Fixed deposit kind of instruments. Retail investor participation has exploded since 2020. But hold on—is this the full picture?. I prefer to let the data talk, rather having just opinions. Like what we did as Employment Reporting in India. From that framework, let’s start.
The US’s "Money Revolution"
US had Stagflation in the ’70s, followed by Reagan’s deregulation and tax cuts in the ’80s, that supercharged markets and corporate profits. So, stock market boomed—by the late ’90s, the S&P 500 had grown over 400% from 1980. The top 1%’s share of income rose from 8% in 1970 to nearly 20% by 2000, while the middle class stagnated—real wages for the median worker barely budged. So, what did the Middle Class did?
They chased wealth through markets, not just labor. By 1990, about 30% of households owned equities, up from 15% in 1970. Mutual funds exploded.
"The point, ladies and gentlemen, is that greed—for lack of a better word—is good. Greed is right, greed works. Greed clarifies, cuts through, and captures the essence of the evolutionary spirit." -Gordon Gekko, in the movie Wall Street (1987)
Wall Street’s Gordon Gekko glorified wealth, making it aspirational, not suspect.
India’s post-COVID narrative
Like America’s then, we are chasing a "money class" lifestyle—think SUVs, iPhones, and stock market bets.
India’s EMI-driven consumption parallels America’s credit card surge, so is the our Demat’s Surge (accounts). The investment asset class in India is also changing, fueled by a phenomenon akin to value migration—where capital and consumer preference shift from traditional, low-yield options to more dynamic/active, wealth-creating instruments. Let’s understand the narratives around this Transformational Shift…
A crucial driver of this value migration is due to the attitudes of the Indian populace towards money and investment. This Evolving Mindsets, has manifested in an increased risk tolerance and a growing understanding of the potential for wealth creation through market-linked investments.
The allure of potentially higher returns compared to traditional fixed-income options is a significant catalyst in this value migration. Growth in mutual fund AUM surpassed bank deposits in the last five years, with mutual funds clocking a CAGR of 17.5% between March 2019 and March 2024, while bank deposits grew at 11.0% during the same period. But, this could also due to base effect, pre-covid, we had very poor market participations.
Digital Inclusivity and the Push for Financialisation is also playing its role. As of March 2024, an astounding 90% of all mutual fund purchases were made through digital channels. This digital transformation, coupled with growing financial literacy initiatives, is encouraging a larger portion of household savings to move from physical assets towards formal financial instruments. The share of mutual funds in Indian household savings has risen from 7.6% in FY21 to 8.4% in FY23.
The Promise of Wealth Creation, Indian mutual fund industry's AUM grew to ₹53.40 lakh crore in March 2024 from ₹23.80 lakh crore in March 2019, registering a CAGR of 17.5%. This signifies a substantial increase in formally managed wealth. The MF industry's AUM as a percentage of GDP reached an all-time high of 18.2% in FY24.
Household Wellness
The Handbook of Statistics on the Indian Economy, published annually by the Reserve Bank of India (RBI), is a often a good mine of data that can indeed be sliced and diced to uncover insights into India’s economic landscape.
The RBI uses the Flow of Funds (FoF) framework to map financial flows across institutional sectors, it then break the Gross Savings under 4 heads- financial corporations, non-financial corporations, general government, and household sector.
As of March 2023, total household financial assets are estimated at ₹363.8 lakh crore, equivalent to 135% of the gross domestic product (GDP).
Household Sector comprises individuals and families. It includes both rural and urban households, covering wage earners, self-employed individuals, and unincorporated businesses. This is How it’s computed:
Gross financial saving + Saving in physical assets + Saving in the form of gold and silver ornaments - financial liabilities
In the RBI’s framework, household sector saving is divided into two main components: financial savings and physical savings. Gross financial savings specifically include investments in instruments such as:
Currency (cash holdings)
Bank deposits
Shares and debentures
Small savings schemes (e.g., post office savings, National Savings Certificates)
Life insurance funds
Provident and pension funds
Here are some interesting insights from RBI’s data
Note: RBI has yet not published 2023-24 data.
Key Insights
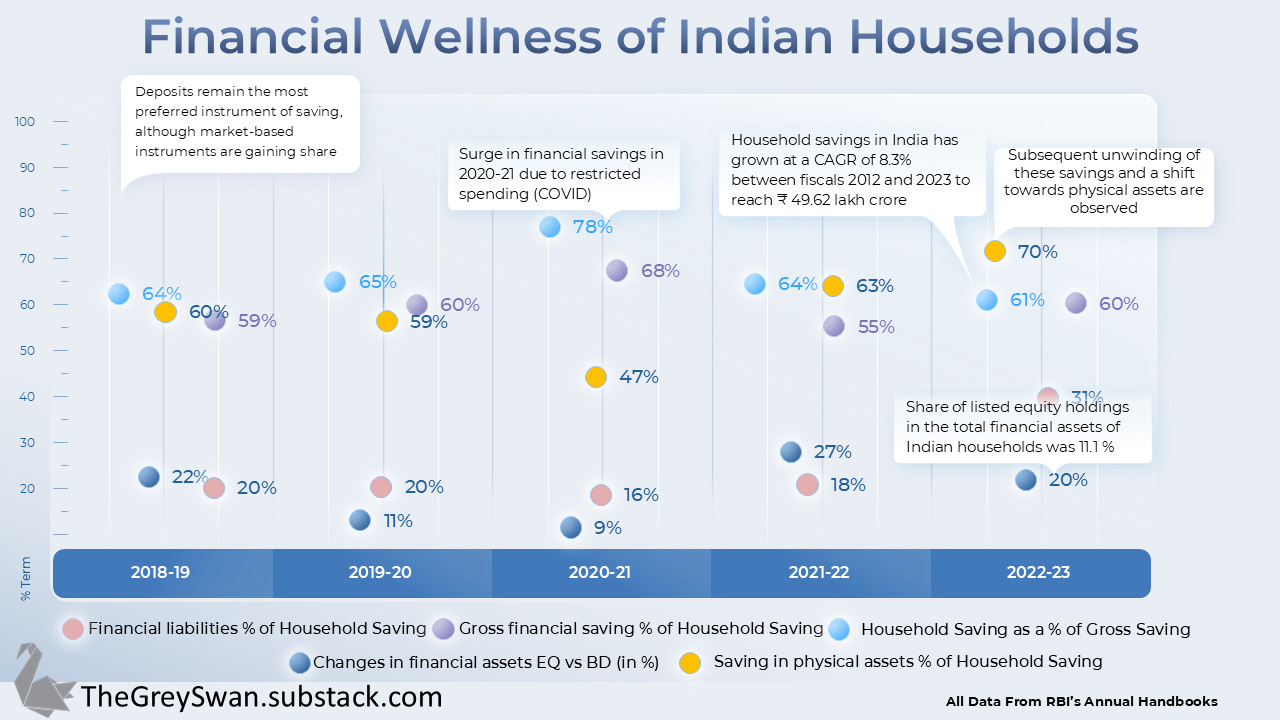
Household Saving as a % of Gross Saving: Household Saving is a largest contributor to domestic savings in India (around 61% of gross savings in 2022-23, but it was 64% in 2018-19 )
Within the Household Saving.
Saving in physical assets such as housing, is highest. We can see a shift towards (70% in 2022-23) physical assets, possibly representing an unwinding of prudential savings accumulated during the pandemic. This is NOT a Gen Z Finfluencers will like to see!
Saving in Gross financial saving remained almost flat in last 5 years. 59% in 2018-19 » 60% in 2022-23, which also means their internal components are changing
Financial liabilities % of Household Saving. There is a Notable increase in the proportion of financial liabilities relative to Household Saving, 31% in 2022-23, from under 20% in the last 4 years. This only lead to RBI’s monetary policy tightening.
Their is another Table as Changes in Financial Assets Liabilities of the Household Sector. Here you can see that
Changes in financial liabilities over last 5 years was 101%, while Changes in financial assets was ~31%.
Now, within the financial assets. The Share of Bank deposits, remained in the same ranges 34% - 35% in last 5 years. Shares & debentures have declined from 7.6% in 2018-19 to 6.9% in 2022-23
Now, this was bit confusing signals. So, I decided to further dig, and got two interesting charts from RBI’s Bulletin July 2024.

This acknowledge the narrative, since the share of equity and investment funds in total financial wealth increased by more than 50% between 2011-12 and 2022- 23.

But this chart confirm that Equity as a New Form of Financial Assets in declining (in 2023 itself).
So, what’s the conclusion?
On the scale of 10, I will put value migration of Indian Household Saving towards Equity, a Hype Score of 5, meaning it might NOT play with narratives been told by everyone on coming 1-2 years.
"The most valuable commodity I know of is information. Wouldn't you agree?" - Gordon Gekko to Bud Fox
So, I am bit cautious till we get better views for certain data
Deposits are Slightly down. The data till March 2023, suggest the change over between Deposits vs Equity is bit Hyped. Infact in this declining market, it would be interesting to see what is happening.
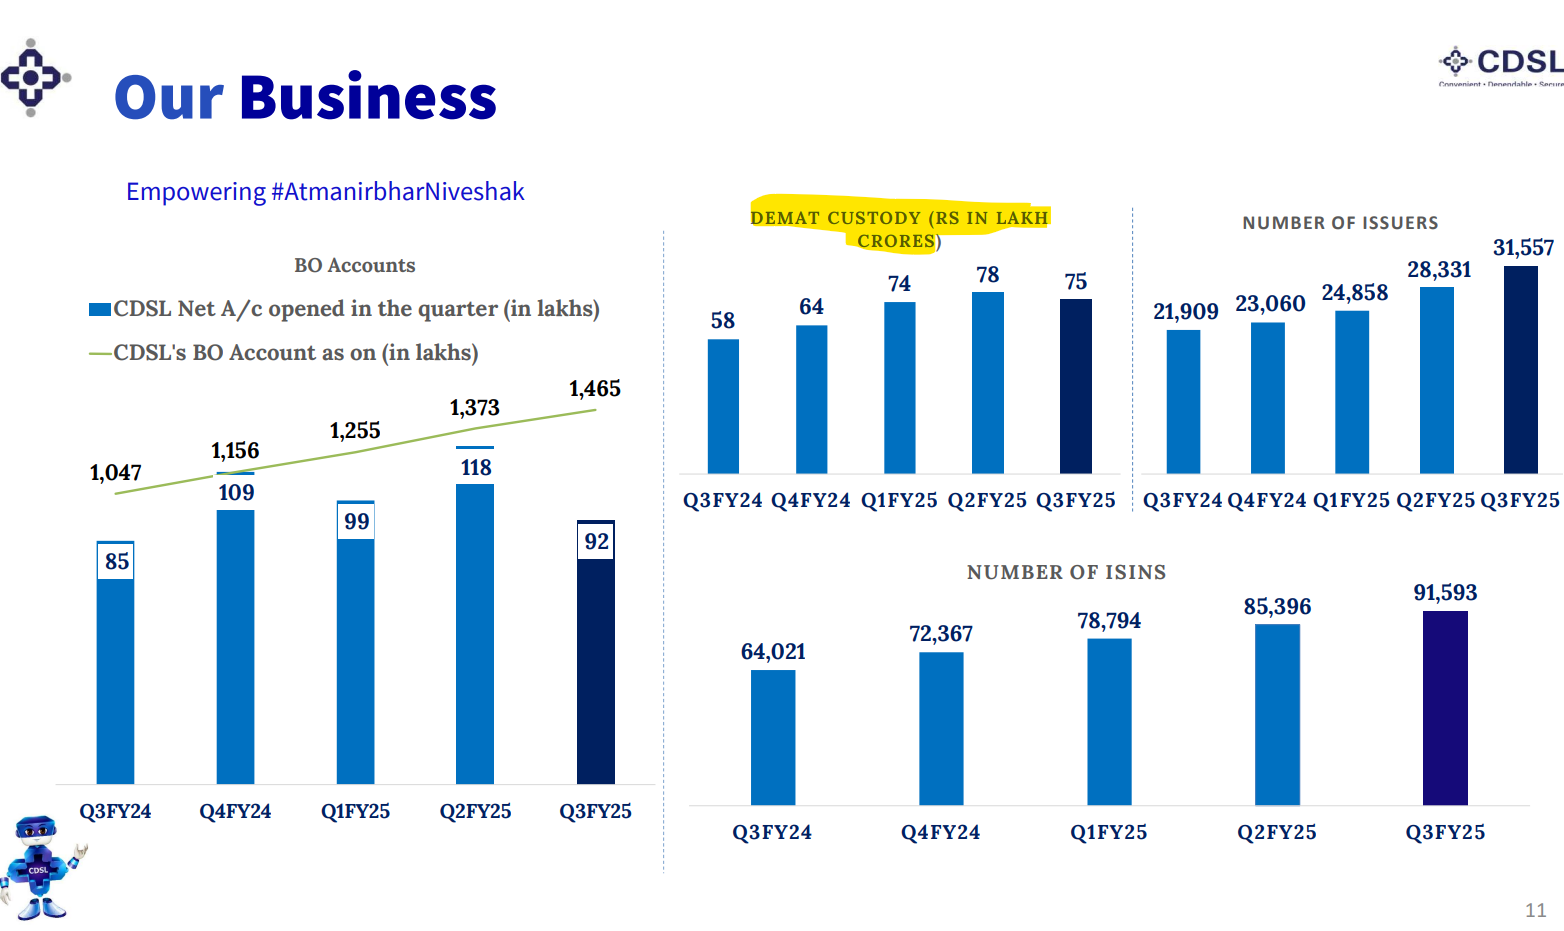
CDSL Data. CDSL’s business is a direct proxy with the narrative of Indian Equity. Now, if you see their recent Deck. DEMAT CUSTODY for CDSL refers to the total value of securities held in electronic form, it’s getting Flat.

Income Tax Perspective: As a second order effect of we have seen good jumps in the recent Income Tax Return (ITR) filings. But still in FY25 we saw a total of 9.19 crore returns filed (ONLY).
I feel we did great with the respect to Financialisation of the Indian economy. But the part of this boom was due to lower base, and growing market. Excepting this to continue will be bit tricky.
Let me give you another example. Search this news,
"The wealth of rich Indians is growing rapidly; between FY19 and FY24, the number of Indians earning over Rs 50 million grew by 49%..."
You will be impressed at the % growth, but please also see the absolute count. Even after 49% growth count of such Indian is 56,596 ONLY.
This has been an interesting piece. Thank you!! However, do you think that new tax rates on capital gains would be another reason for further decline in participation of retail investors in capital markets?