


The State of Housing Loan Sector in India.
Income Segmentation Analysis.
Housing occupies a unique economic niche, blending consumption with investment in a way few goods replicate. Unlike typical consumables—food or clothing, which degrade with use—housing delivers utility (shelter, warmth, sleep) while often appreciating in value over time. This dual nature, shared by rarities like antiques, fine art, and vintage wine, sets it apart. As you own a home, its price can climb, driven by market demand, location, or economic trends, even as wear and tear nibble at its physical state.
Economists see this duality—part necessity, part speculative vehicle—as key to its volatility. Unlike stocks, you live in it; unlike wine, you don’t wait decades to "consume" its worth.
A substantial portion of individual housing loans disbursed in India, is for the acquisition or construction of new houses, indicating continued asset creation. The Southern, Western, and Northern states continue to dominate in terms of both outstanding portfolios and disbursements.
The Early Start.
Over the past two decades, India’s housing loan market has undergone a remarkable transformation, evolving from a niche financial product to a cornerstone of the country’s economic growth. In the early 2000s, home loans were relatively uncommon, with outstanding credit hovering around ₹1.5 lakh crore, driven largely by public sector banks and limited housing finance companies (HFCs) like HDFC [long back we wrote about this origin]. The mortgage-to-GDP ratio lingered below 3%, reflecting low penetration and a reliance on personal savings for home purchases. However, liberalization, urbanization, and rising incomes sparked a seismic shift.
From 2000 to 2010, housing loans grew at a compounded annual growth rate (CAGR) of over 20%, fueled by economic reforms, a burgeoning middle class, and government initiatives like tax incentives on home loan interest. By 2010, outstanding housing credit reached ₹4.5 lakh crore, with private banks and HFCs expanding their footprint. The next decade, 2010–2020, saw growth moderate to a CAGR of around 15%, as the market matured and faced challenges like the 2008 global financial crisis and the 2016 demonetization. Still, outstanding loans climbed to ₹19 lakh crore by 2020, per Reserve Bank of India (RBI) data, with the mortgage-to-GDP ratio nearing 10%.
The Recent Growth of the Housing Loan Sector:
Note: All the data is from the Report published by National Housing Bank (NHB), as ‘Report on Trend and Progress of Housing in India’.
The sheer scale of growth in India's housing finance sector is undeniable.

In absolute terms, outstanding housing loans have surged from around ₹2,000 crore in 1986-87 to over ₹22 lakh crore by the end of FY 2021, reaching ₹25.11 lakh crore as at March 2022, and further climbing to ₹30.92 lakh crore as on December 31, 2023. This remarkable growth underscores the increasing importance of housing finance in the Indian economy.
Regional Concentration Data Patterns:
The Southern, Western and Northern States of the country account for 35.02%, 30.14% and 28.73% share respectively, of the cumulative disbursements done during H1FY 2024-25 whereas the share of Eastern states (inclusive of the north-eastern states) is 6.1%.
Around 13 states contribute approximately 90-91% of the IHL outstanding. These include Maharashtra, Karnataka, Tamil Nadu, Gujarat, Telangana, Uttar Pradesh, Andhra Pradesh, Kerala, Rajasthan, Haryana, Delhi, West Bengal, and Madhya Pradesh.
The state-wise distribution as of September 2024 showed:
Maharashtra ranked the highest with a share of 18.49%.
Telangana followed closely with 18.44%.
Karnataka had a ratio of 14.28%.
Chandigarh UT recorded the highest ratio at 25.91%.
For the Central States & Eastern States, North-Eastern States and States of Jammu & Kashmir and Himachal Pradesh, the ratio ranged from 1.5% to 7.8%.
Here is another table about the total disbursement from a state and Urban and Rural split. Here also Maharashtra (17%), Telangana (13%), and Karnataka (12%) top the list, with 90%, 93%, and 90% as Urban loans. Tamil Nadu and Andhra Pradesh have lowest Urban concentration, ~78%.


Scheduled Commercial Banks (SCBs) hold the largest market share in individual housing loans. As of September 2024, the share of Housing Finance Companies (HFCs) in the total outstanding individual housing loan portfolio was 19.0% and Banks (including Public Sector Banks, Private Sector Banks and Regional Rural Banks) held 81.0%.
Moderate Growth and Evolving Dynamics.
As of September 2024, the total outstanding IHL reached ₹33,53,668 crore, marking a 14.08% annual growth. However, the growth rate appears to be moderating when comparing the first half of FY 2024-25 (4.04% year-on-year growth in disbursement) with the full FY 2023-24 (19.88% year-on-year growth in disbursement). Before we move forward and give you the internal dynamics of these loans, from the point-of-view of Income Groups:

So, trends suggest:
EWS and LIG segments have experienced consistent growth, supported by government schemes, but potentially at a more moderate pace compared to other segments in very recent times.
MIG segment has remained a dominant player in the IHL market for HFCs, showing continuous activity.
But it’s HIG segment that has exhibited strong growth in the last couple of years, gaining a larger share of the overall IHL portfolio for HFCs.
Examining the trajectory of housing loan growth is crucial to understanding the evolving dynamics of the Indian real estate market and the extent to which different income segments are benefiting from increased access to finance.
There is another interesting table that talk about the Purpose-wise Disbursement of Housing Loans to Individuals by HFCs for the last 3 years.
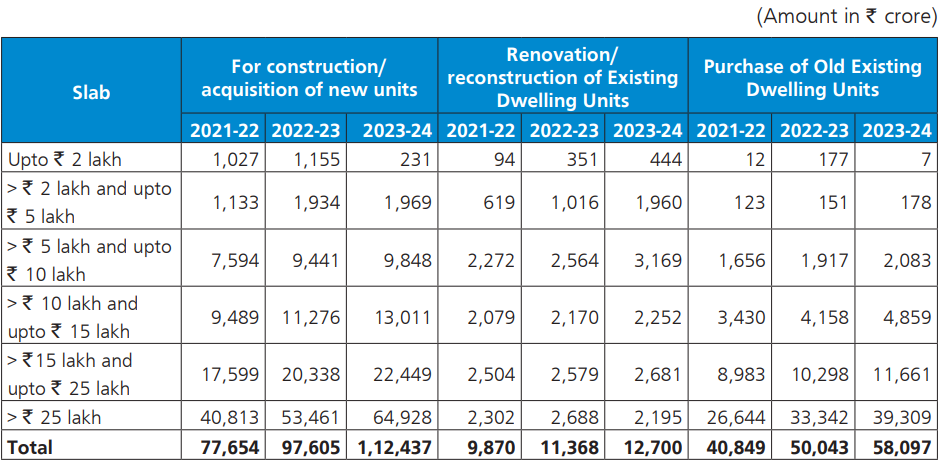
Here, you can see:
For the 3 years, % composition remained same for (i) New units ~61%, (ii) Renovation ~7%, and (iii) Old units ~32%. But growth rate is quite different, New units has grown 45% in these 2 years, Old Units at 42%, but Renovation has grown just at 29%.
Loans for upgradation consistently account for a smaller share of the total disbursements, suggesting that the primary drivers of loan growth are property acquisition rather than home improvement.
The observed anomalies in the "Upto ₹2 lakh" slab may reflect policy changes that either reclassify or de-emphasize very low-value transactions.
Expenditures above ₹25 lakh account for the largest portion of investments. In 2021-22 it was 54% of overall amount, it is now 58% in 2023-24, indicative of a strong emphasis on high-value real estate.
Now, for a better interpretation, I have converted this table with % for all the 3 compositions within a year. Thus, the combined base in (₹ crore) are:
2021-22 ₹1,28,373
2022-23 ₹1,58,111
2023-24 ₹1,83,234

So, > ₹25 lakh New unit was 32% in 2021-22, and has grown to 35% in 2 years.
This consistent increase in the proportion of higher-value loan disbursements suggests a significant driver of growth in lending towards properties that are likely to be in the higher price brackets.
Lastly we can see another patter.
Declining Interest Rates: The weighted average lending rate on outstanding individual housing loans for SCBs declined by 147 bps from 8.99% in Q1 FY20 to 7.52% in Q1 FY22. For HFCs, it declined by 144 bps during the same period. These lower interest rates have improved housing affordability. The weighted Average Lending Rate of Outstanding Individual Housing Loan declined further for SCBs from 8.62% in March 2020 to 7.34% in March 2022, and for HFCs from 9.69% to 8.01% during the same period.